Obvious But Overlooked: How to think about startup valuation in 2023
There is an age-old assumption in VC investing that the main metric correlated with successfully raising a round - including the valuation - is ARR (annual recurring revenue). It might sound like: “reach $1M ARR and you will get funded, reach $5M ARR and the valuation will be x higher…”
It’s clear why this hypothesis exists. VCs constantly allude to it with founders:
● “We don't see enough traction yet.”
● “Our current threshold is $3M ARR.”
● “Come back when you have ten paying customers.”
Sound familiar?
Psst… The truth is, these statements are often a dealflow/time management shortcut, as investors can’t diligence thousands of start-ups. The ARR metric is used as a gateway to focus on those companies more likely to be relevant.
But does this correlation hold post-due diligence and term sheet? Do we actually see ARR as the primary driver or possibly only one indicator of many for early stage companies?
In practice, we don’t.
Unfortunately, there is very little data available (never mind accurate) on early stage valuations and ARR at the time of raise, so it's hard to test this hypothesis. However, we still decided to take all A & B rounds in our portfolio and test this hypothesis (of course we have a lot more granular data to work with this way too).
Yes, I hear you saying: “Wait, there are varied sectors, and different founders, and some people may present better on Zoom…” and other factors to take into consideration when considering this. It’s a given that our data set is limited, but I think it’s worth appreciating:
- Some of the findings are actually quite significant.
- The purpose of this exercise is to leverage this dataset to provoke a conversation around this assumption of a clearcut ARR-valuation correlation that we haven’t been having in our industry.
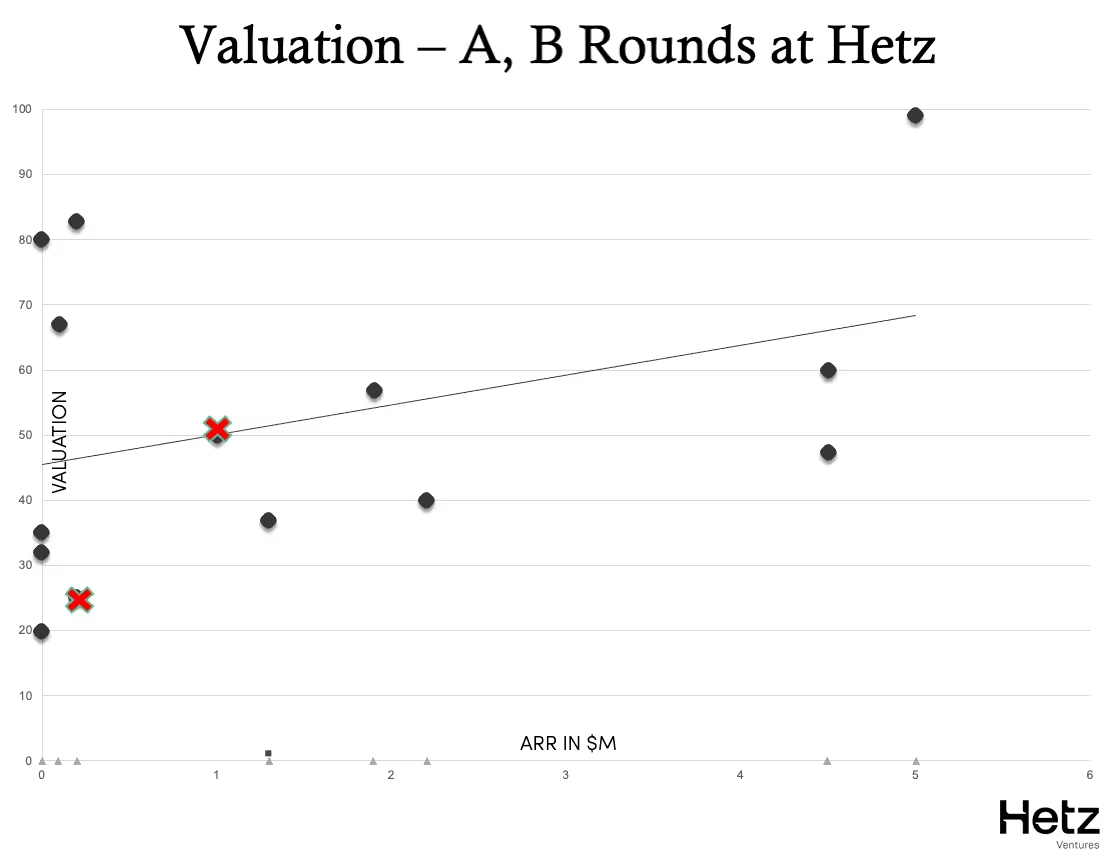
First, let’s look at the actual correlation between ARR and Valuation in this dataset. (Note, the red Xs represent companies that had the intention of raising and didn’t manage.
Valuation: A, B Rounds at Hetz
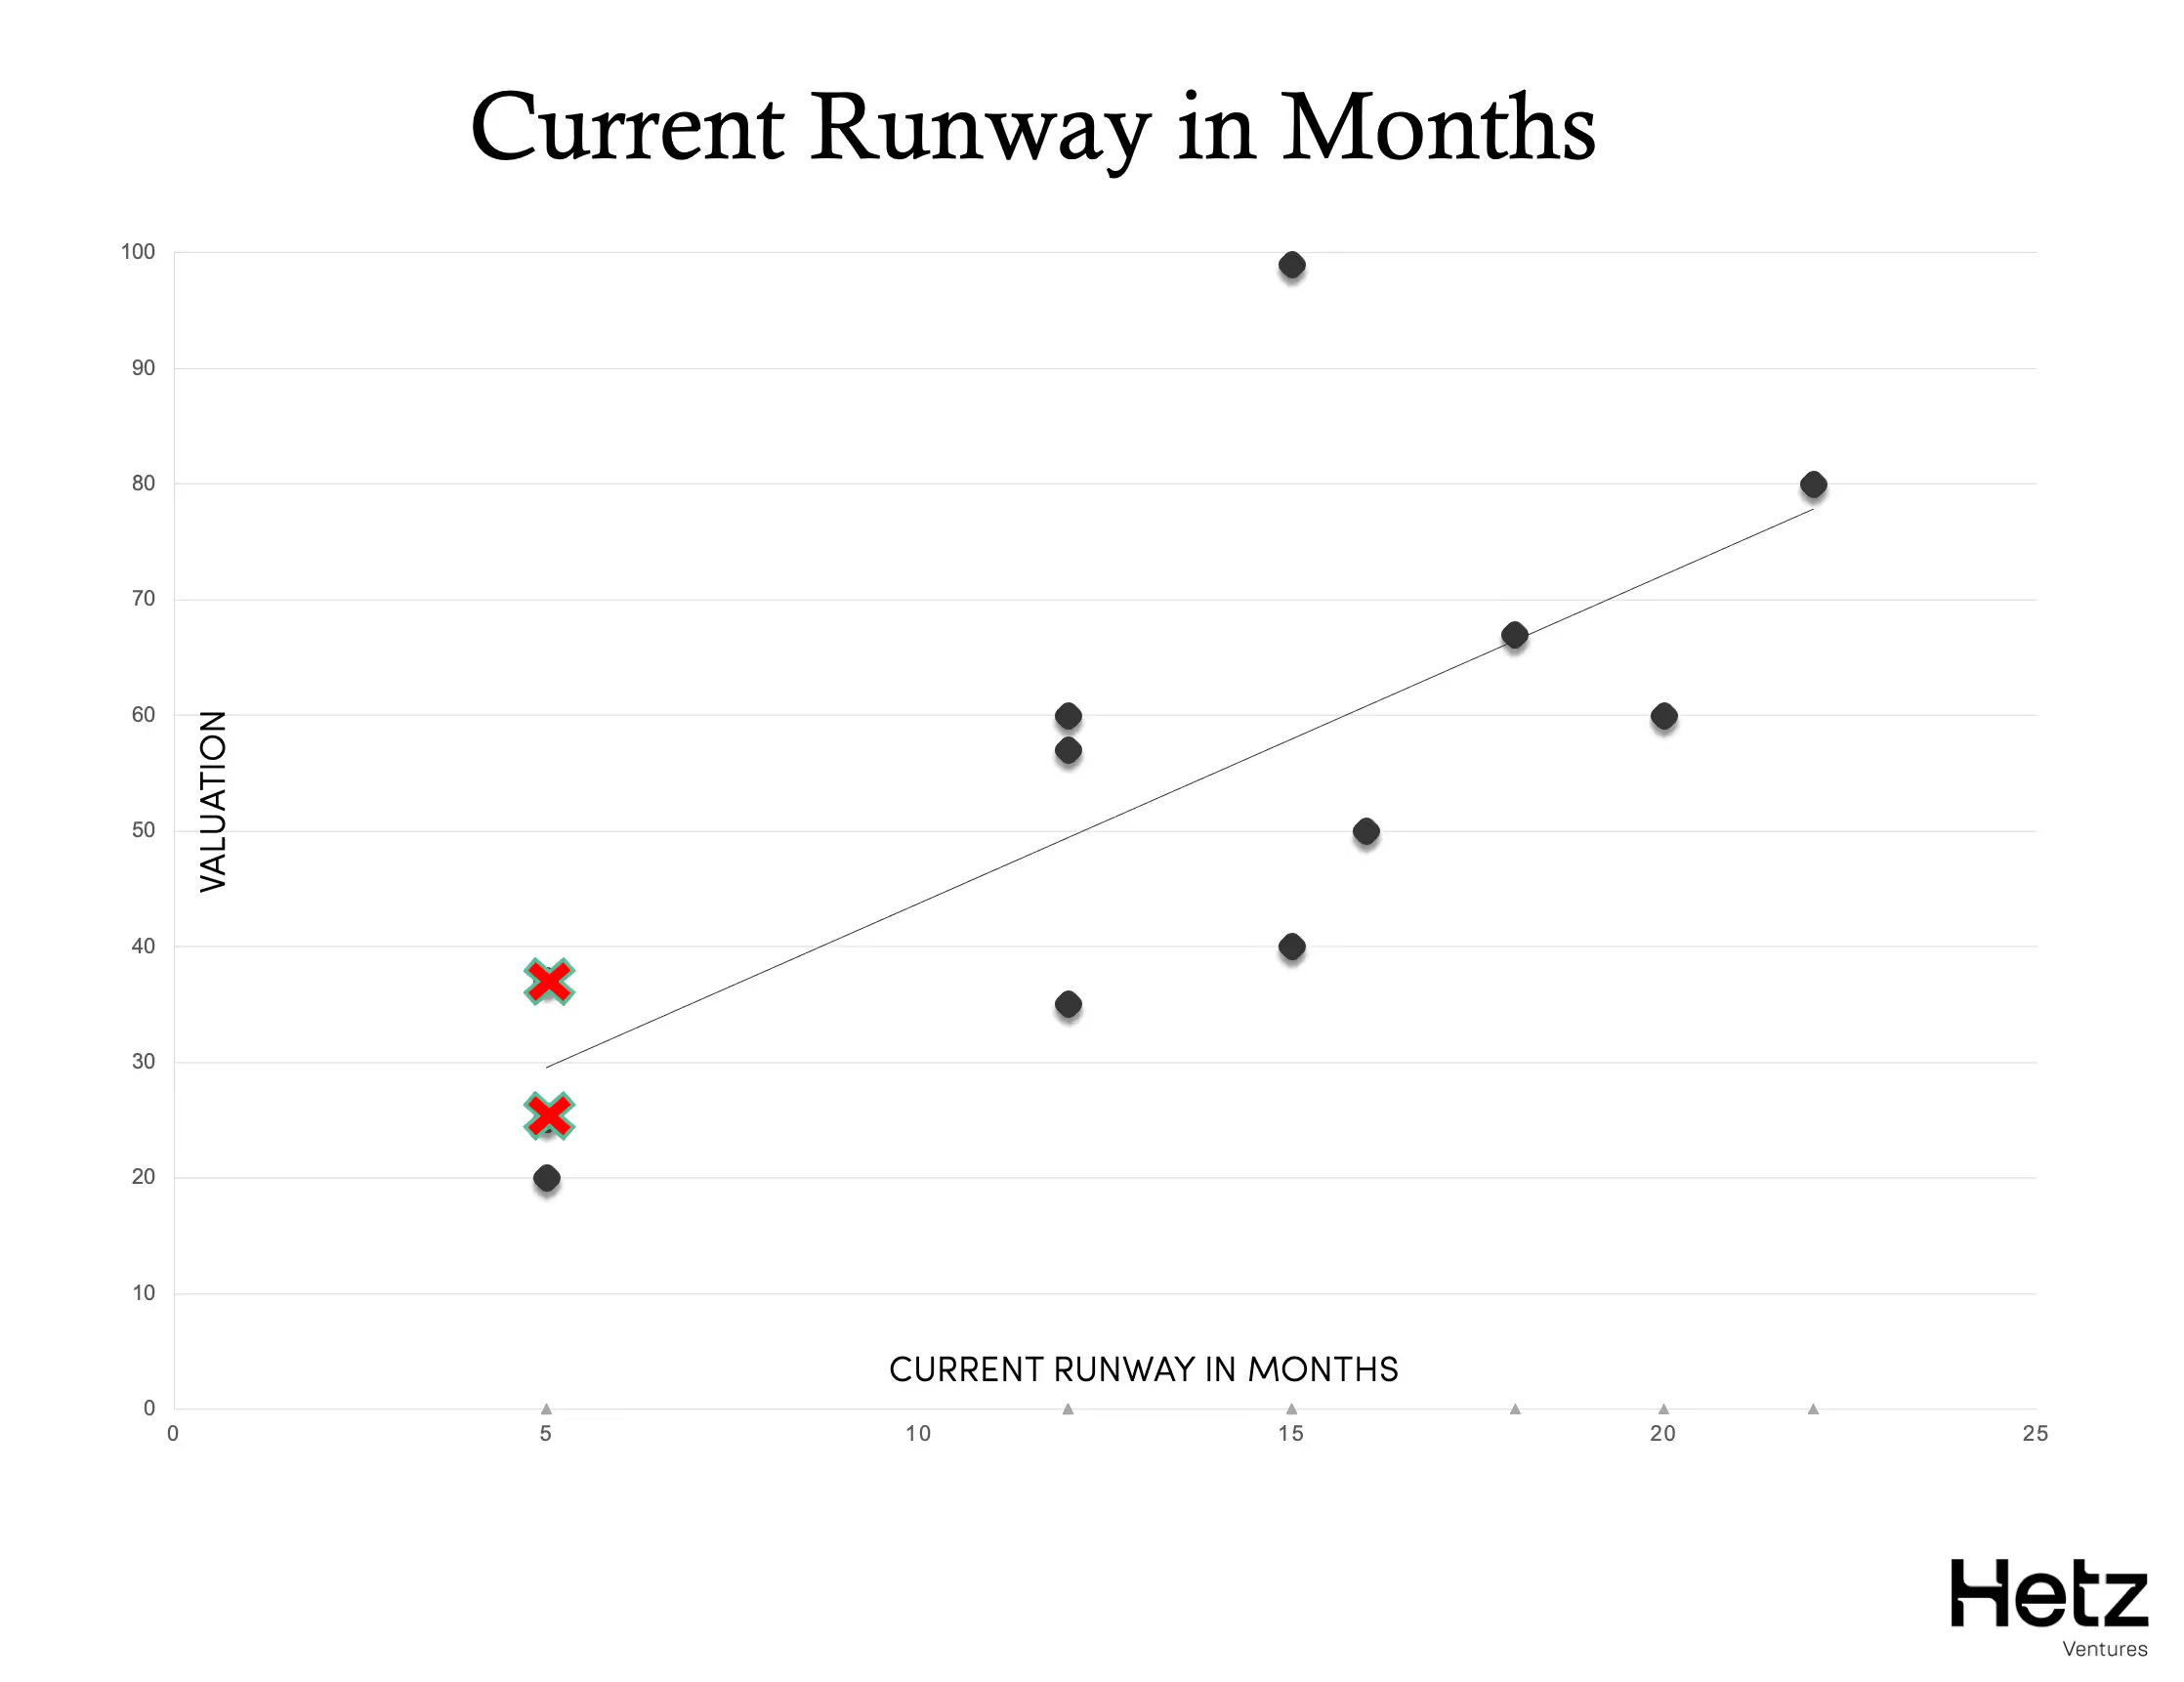
We looked for other potential correlations and found two that were particularly strong, especially when reviewing the post 2022 data. First is Current Runway when raising.
Current Runway in Months
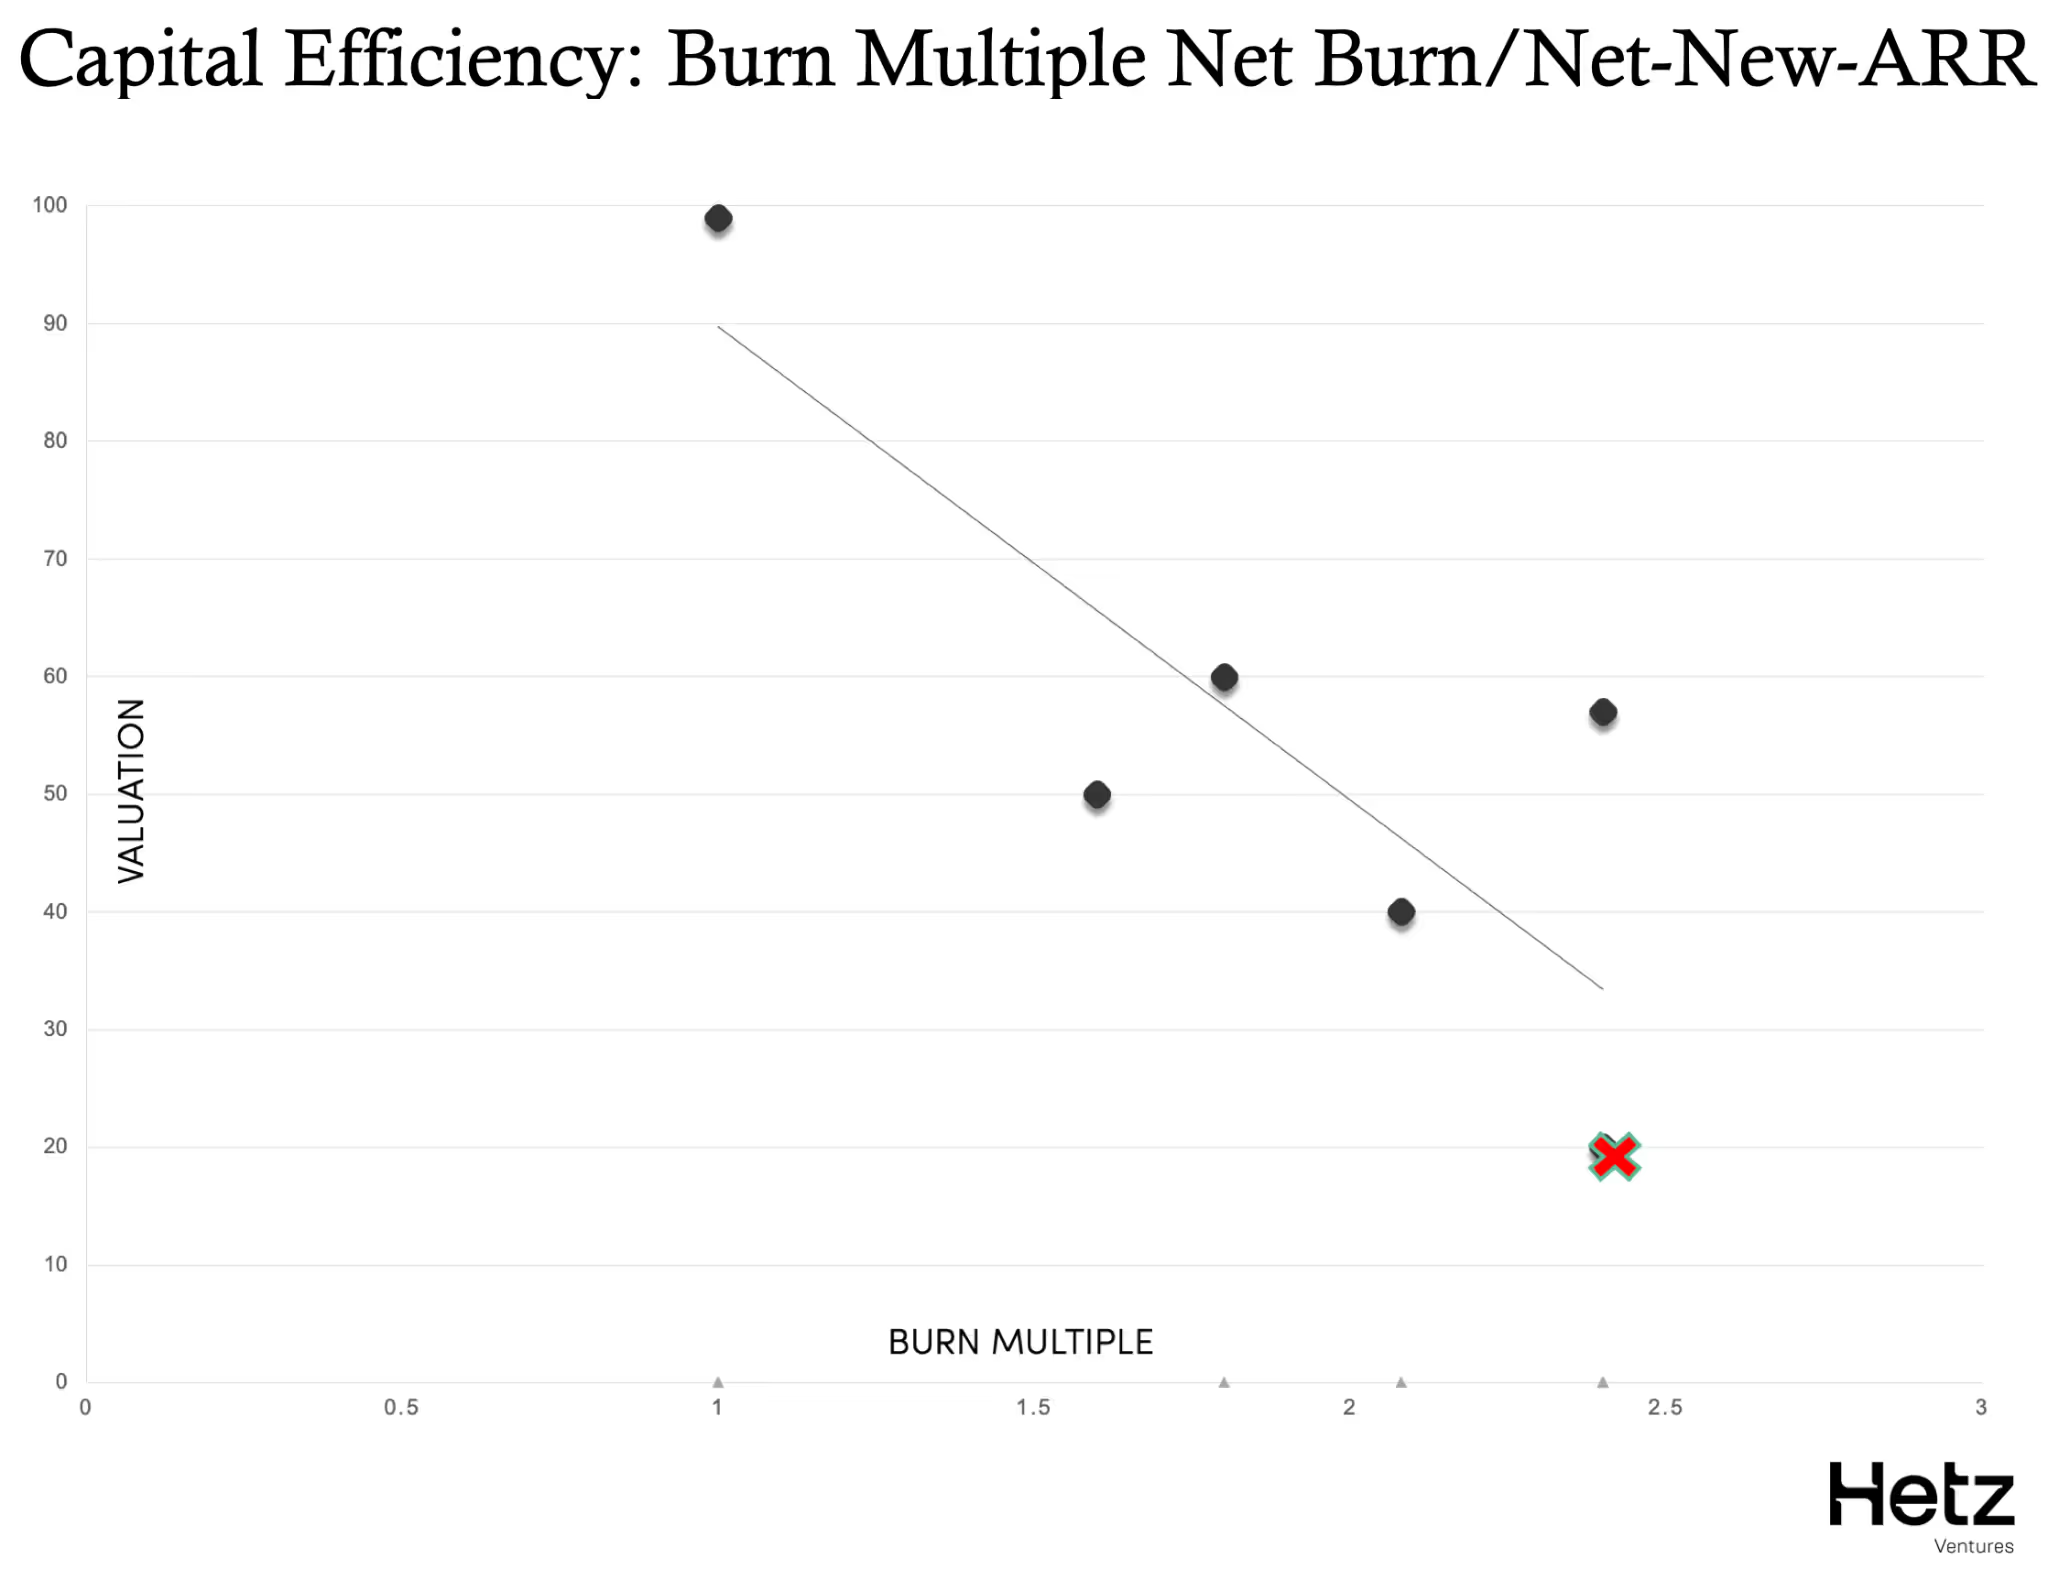
We also looked at capital efficiency:
Capital Efficiency: Burn Multiple Net Burn / Net New ARR
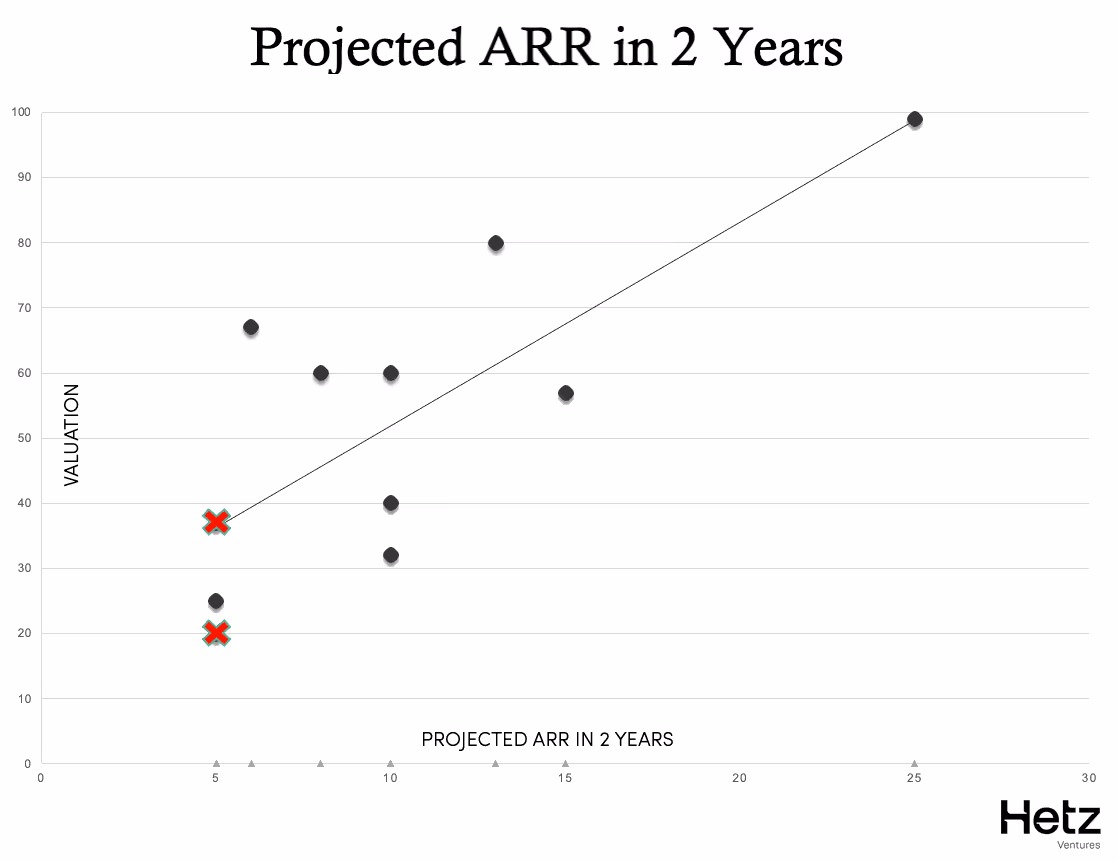
The connection between all these data points, including the Valuation/ARR in Graph 1, is that building a start-up - and raising capital for it - is essentially telling a story. The start-up’s story must be compelling and lead to a massive outcome - hopefully not too far in the future - where the start-up is generating lots of capital in an efficient way. Your ARR today is a data point in that story, and having more ARR is likely to assist in justifying you are on the right track, but that is only true if the rest of the story aligns.
We tested this. We took all the start-ups 24-month-projected-ARR and plotted that against the valuation they got and suddenly the correlation was clear:
Projected ARR in 2 Years
Finally, for anyone left thinking, “So what, I will just project huge growth!” - here is the graph of the original projections the start-ups made at the start of their raise (before adjusting them to meet the story the lead investor ultimately accepted as part of their round):
What founders originally pitched as 'ARR after 2 years'
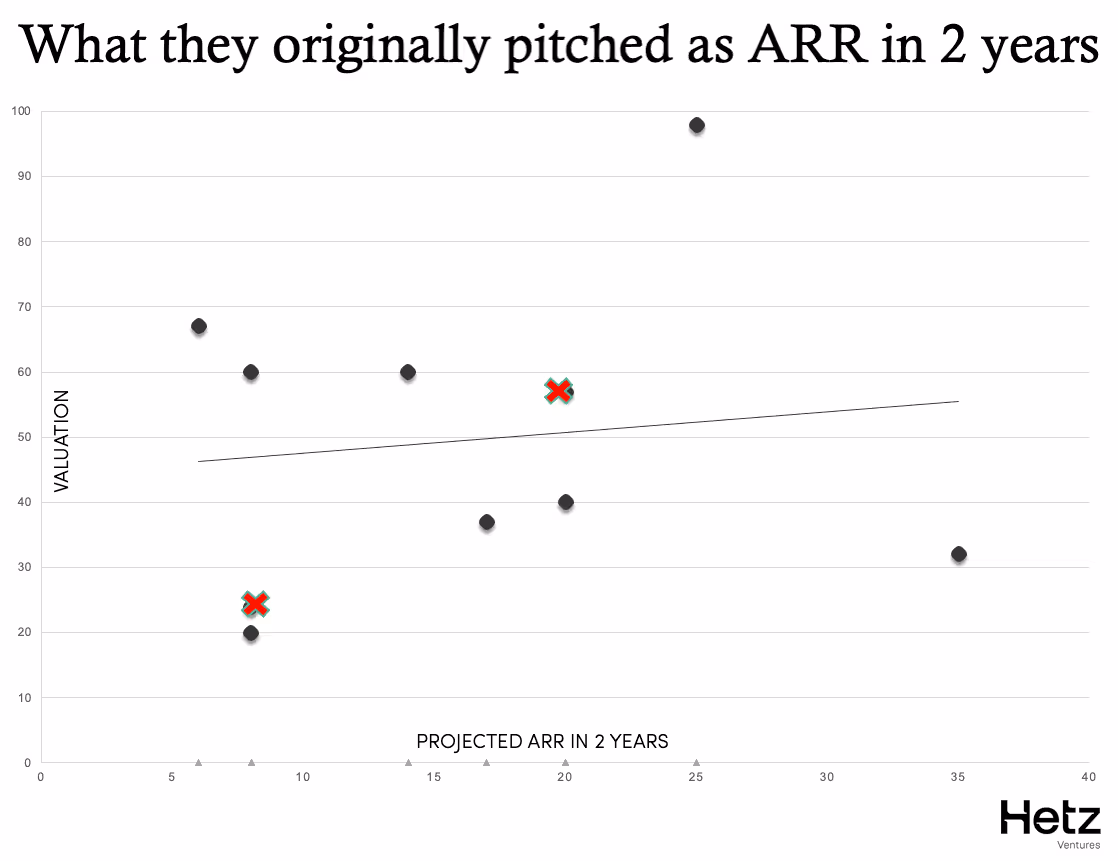
Note: In this final graph we took the data the start-ups originally projected when they went to raise. The difference is a number of cases such as a start-up projecting very high growth, not raising, adjusting, and then raising. Or, the lead investor adjusting the projections as part of the round.
When we talk about ‘market correction,’ we often assume it simply means that a line on a graph that was previously going in one direction has now adjusted, or that multiples previously 20X might now be halved. From a bird's eye view this might be true, but aggregating the data you expect to paint the whole picture actually doesn’t always tell the full story.


.jpg)